Understanding Candlestick Patterns for Beginners
- LIGHTNING MCQUEEN
- Aug 30
- 2 min read

Candlestick charts are one of the most popular ways to study price action. Each candle represents the battle between buyers and sellers in a given time frame. By learning a few simple candlestick patterns, beginners can start spotting signals about possible reversals or continuations in price.

Let’s look at four of the most important patterns every trader should know:
1. Doji
What it looks like:A Doji has a very small body with long wicks on either side. It shows that the opening and closing prices were almost the same.
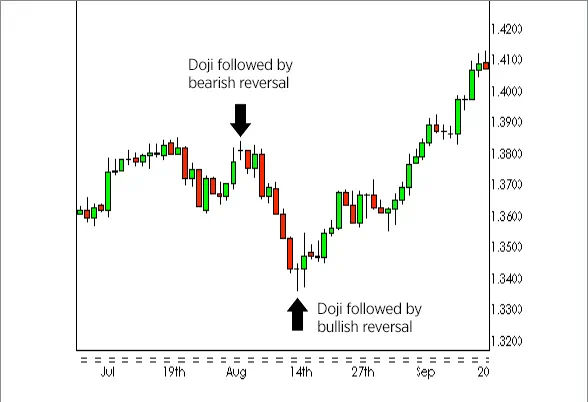
Meaning:
Indicates indecision in the market.
Neither buyers nor sellers are in full control.
Often appears before a reversal or major breakout.
With Volume:If a Doji forms with high volume, it suggests strong indecision and can signal a big move ahead. With low volume, it may just be a pause.
2. Hammer
What it looks like:A small body near the top of the candle with a long lower wick (at least twice the size of the body)

.
Meaning:
Appears after a downtrend.
Shows sellers pushed the price down, but buyers fought back strongly and closed near the top.
Often signals a bullish reversal.
With Volume:A hammer on high volume is more powerful, because it confirms that buyers actively stepped in at that level.
3. Engulfing Pattern
What it looks like:
A bullish engulfing occurs when a green candle completely covers the body of the previous red candle.

A bearish engulfing is the opposite: a red candle fully engulfs the body of the previous green candle.

Meaning:
Bullish engulfing at the bottom of a trend → possible uptrend beginning.
Bearish engulfing at the top of a trend → possible downtrend beginning.
With Volume:If the engulfing candle comes with higher-than-average volume, the reversal signal is much stronger.
4. Shooting Star
What it looks like:A small body near the bottom with a long upper wick. The wick should be at least twice the body length.

Meaning:
Appears after an uptrend.
Shows buyers pushed the price up strongly, but sellers rejected the move and closed near the low.
Often signals a bearish reversal.
With Volume:If a shooting star forms with strong volume, it confirms sellers are taking control.
Key Takeaway
Candlestick patterns are like short stories of market psychology. Alone they are useful, but when combined with volume they become much more reliable.
Doji → indecision, wait for the next move.
Hammer → bullish reversal after a fall.
Engulfing → strong reversal signal.
Shooting Star → bearish reversal after a rise.
For beginners always remember: one candle doesn’t guarantee the future. Combine patterns with trend analysis, support and resistance levels, and volume for higher accuracy.
Disclaimer: This blog is for educational purposes only. The candlestick patterns and examples discussed here are meant to help you understand chart analysis. They are not buy or sell recommendations. Trading and investing in the stock market involve risk, and you should always do your own research or consult a financial advisor before making decisions.


Comments